Friction AFM

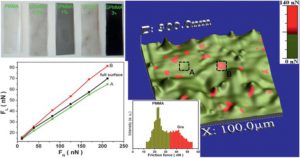
Topography and contact-mode friction AFM image of the PMMA–graphene composite with normal force 80 nN. The colour on this figure corresponds to values of friction force. Insert: histogram of the friction AFM image. The plot of the friction force (FL) versus the applied load (FN) for the full surface, for area A (PMMA) and for area B (GPMMA) shown in the image.
Gil Goncalves, Paula A. A. P. Marques, Ana Barros-Timmons, Igor Bdkin, Manoj K. Singh, Nazanin Emamic and Jose Gracio, Graphene oxide modified with PMMA via ATRP as a reinforcement filler, Mater. Chem., 2010, 20, 9927–9934, DOI: 10.1039/C0JM01674H
https://pubs.rsc.org/en/content/articlehtml/2010/jm/c0jm01674h

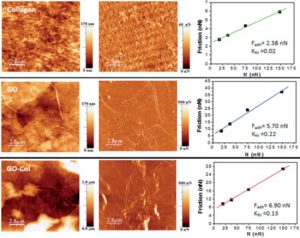
AFM topography and friction (normal force 75 nN) images. Frictional versus load curves over four load increments for determination of friction coefficient (Kfri) and adhesion force (Fadh) of different materials.
Andre F. Girao, Gil Gonçalves, Kulraj S. Bhangra, James B. Phillips, Jonathan Knowles, Gonzalo Irurueta, Manoj K. Singh, Igor Bdikin, Antionio Completo and Paula A. A. P. Marques, Electrostatic self-assembled graphene oxidecollagen scaffolds towards a three-dimensional microenvironment for biomimetic applications, RSC Adv., 2016, 6, 49039, https://pubs.rsc.org/en/content/articlelanding/2016/ra/c6ra10213a#!divAbstract


